Living Pasts: Exploring Futures
Anouk van Wijhe, David Skogerboe, Thomas Wind, Toine Pieters
December 15, 2025 – Article Shells and Pebbles
An innovative course connecting students to history, and history to the world of endless possibilities.
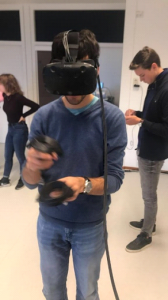
The first thing students learn in the Living Pasts: Exploring Futures course is nothing will unfold quite the way they expect. On day one, no detailed overview of the course exists… yet. Students are told that the finer details take shape as the course progresses and that the journey is where the magic happens. The students are primarily made aware that they will be tasked to co-design an innovative public-facing prototype about an aspect of the city that conveys its history, present day function, and imagined role in the future. From this intentionally vague starting point, the students are given a tour within the city designed to highlight the innumerable traces of history largely invisible to the untrained eye (Fig. 1). And to point out the relevance of that history for understanding and addressing urban and social challenges in our present and future.
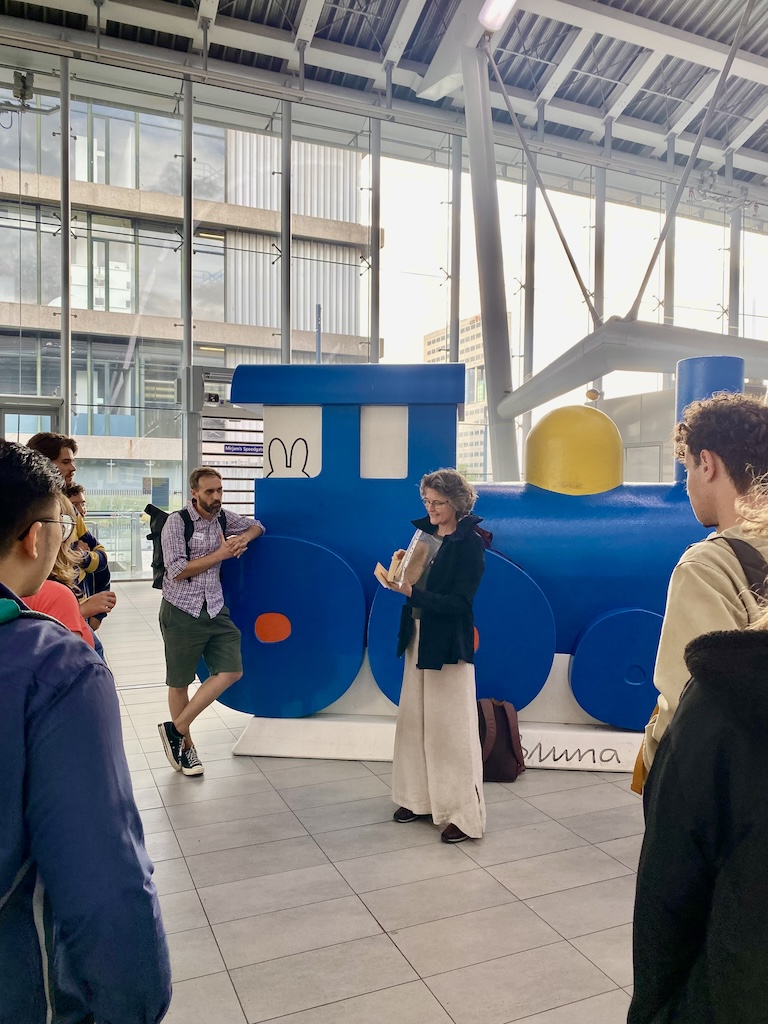
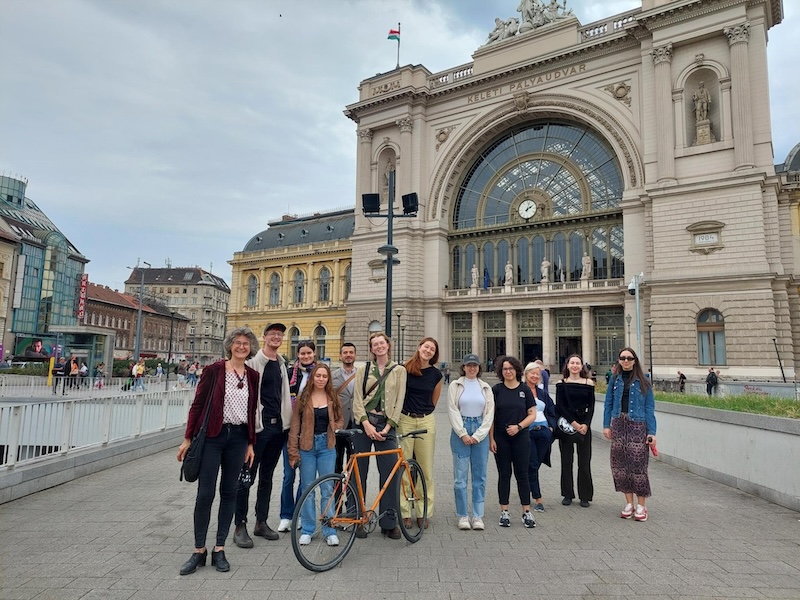
Fig. 1: Students in Utrecht and Budapest tour the city on day one.1
From there, the students are introduced to a specific theme that serves as the historical starting point for the course (the theme changes for each iteration of course) and are given a group task to take photos that represent that theme in any way they see fit. By design, this first session is intended to set the tone for the course, and the high level of student autonomy that comes with it. In the first few weeks, students articulate three Personal Learning Goals (PLGs) that they will focus on throughout the course – for example, learning the software to create Augmented Reality or improving the ability to manage projects. They also conduct historical research and explore the theme in a more traditionally academic manner (a research paper), to ground their future prototyping in literature and primary source materials. With the foundation set, students place themselves into interdisciplinary teams (of 3-4 students) that consider everyone’s PLGs, and they are sent off to ideate, experiment, test, and develop a prototype co-designed by the team, course facilitators, and stakeholders within the community. Fall 2025 marked the 10th iteration of the course, and the results of this process were yet again impressive! But before sharing the 6 prototypes produced this year, it is important to better understand the course itself to truly appreciate its results.
The History of Living Pasts: Exploring Futures
The prize-winning Living Pasts course was initiated at Utrecht University (UU) in 2019, sparked by a conviction that engaging with the past could be made more accessible and transformative through an emphasis on digital media and direct collaboration with the community.2 The course was thus designed around four core principles: design-based learning, inter- and transdisciplinary education, community engagement, and co-creation. To elaborate on this, design-based learning treats making and prototyping as tools for inquiry, and a transdisciplinary approach encourages students from different backgrounds to approach a shared topic from multiple angles using knowledge from extra-academic sources.3 This work then takes place within the city itself through community engagement, as students have to make a prototype aimed at a target audience, where it is important to collect information and feedback from external stakeholders (such as local archives, museums, the municipality, or business owners) to develop projects with societal relevance.
Above all, the course is guided by co-creation: students build a prototype together, continually adapting their design based on input from a variety of sources.4 They are also co-responsible for the content of the course, by, for example, requesting workshops that provide specific expertise or asking for tailored guidance based on a specific need. The students are expressly invited to also help lead these workshops. In this spirit, the course emphasizes facilitative teaching, supported by instructors and student-assistants who act as “mentor-participants” (also known as ‘facilitators’ in the Living Pasts course), rather than traditional lecturers.5 In bringing students deeper into the mold, and tasking them to continuously reflect and look back on their experience, they are empowered to shape their projects (and the course) into alignment with their own personal, and professional goals.
Living Pasts: Exploring Futures is a course that was designed to innovate, meaning the course itself is subject to experimentation and change. Over the years many new aspects have been added to the course, such as self-assessment and incremental grading, digital and material fabrication through the makerspace Lili’s Protolab, and since 2023 a focus on intercultural competences. Via a partnership facilitated by CHARM-EU – an alliance of nine European universities promoting inter-European collaboration – a parallel Living Pasts: Exploring Futures course was initiated at Eötvös Loránd University (ELTE) in Budapest, Hungary. Throughout the course students come into contact with each other digitally to provide valuable peer feedback, explore cultural differences and similarities, and test their prototypes.6 And after ten weeks of intensive work, the students across the Budapest and Utrecht courses produced 6 high-fidelity prototypes that explored the past and envisioned the future.
“Stations”
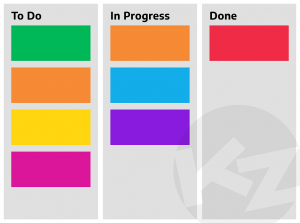
As the course was initiated in Utrecht, past iterations were based on neighborhoods in the city (for example Lombok and the Utrecht Science Park). However, once the partnership with CHARM-EU began, the themes shifted to being more abstract to allow greater cohesion between the two universities.7 The theme for the 2025 iteration of the course was “stations”, a concept deliberately left open to numerous interpretations. On one level, it could be interpreted as the physical stations within both Budapest and Utrecht’s history—for example, their central train stations. But a “station” can also be understood more abstractly as any point where people, ideas, or systems converge. It might take the form of a demographic station where communities meet, an ecological station where species and landscapes interact, a linguistic station where dialects overlap, or a technological or cultural station shaped by innovation and identity. When the students convened for their first day of the course, this was the theme they were introduced to, and the variety of interpretations signaled an exciting array of possibilities (Fig. 2). What followed was a weeks long process of research, ideation, design-cycles, and prototyping.

Fig 2: Screen capture of a Mentimeter showing the UU student’s initial interpretations of the theme on day one.
The Prototypes:
Utrecht University
Child-Guided Design: Viewing playgrounds as a station for child interaction, the Child-Guided Design team set out to address a persistent challenge in municipal playground development: how to meaningfully include children’s perspectives in ways that designers can actually use. The team’s original ambition was to design the “perfect playground”, but through the iterative design-cycles of research (including the history of approaches to playgrounds), field interviews with children and parents, and expert consultations with playground designers and the municipality, it became clear that there wasn’t any one perfect playground, and there was an inadequate process in place to properly consult with children – the ultimate users. Based on this feedback and drawing from the principle of co-design in the course, they opted to develop a research-based co-design guidebook for future playground designers to use in running workshops with children aged 8-10. This included a number of 2D and 3D (printed) activities, as well as instructions on how future guidebook users could leverage 3D printing and AI-assisted model generation to tailor their kit to their specific needs (Fig. 3). Overall, the idea of developing a toolkit to help designers better utilize the imaginative ideas of children in their technical playground designs is a prime example of the creative outcomes of empowered students.

Fig. 3: 3D printed model of an activity to be used in the customizable child-guided playground design workshops.
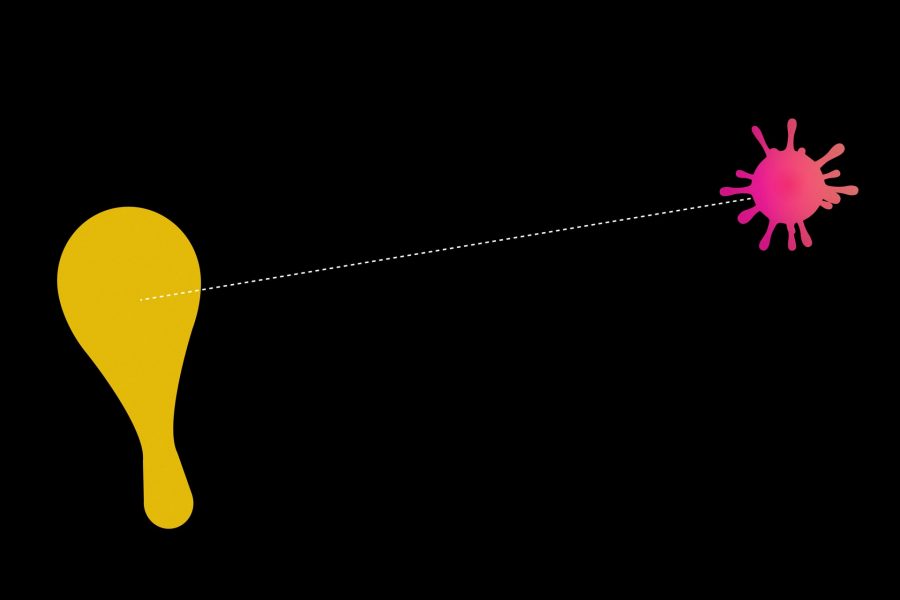
Botanical Gardens: This team approached Botanical Gardens as stations for connecting humans with nature. However, the historical legacy of these gardens as educational and research entities prompted the team to note the unapproachable text-heavy plaques found at the local UU Botanical Garden. From this, the team began by asking how visitors (often there for leisure, not research) could better connect with plants, and plant information, to increase environmental awareness. At the beginning, their ideas were centered on interactive trails and possible augmented-reality experiences. But after speaking with visitors and staff (including the Director) – thus getting feedback straight from the source – it became clear that botanical garden enthusiasts wanted something more personal and low-threshold. After several ideation sessions, the group converged on an audio-based “talking plant” (a Cocos Orchid, to be precise) made from laser-cut wood and housed in a recycled pot, designed to draw in visitors (Fig. 4). The prototype relied on a compact audio module, a lightweight speaker, and a rechargeable battery pack, carefully arranged inside the pot so that the electronics remained invisible and protected from moisture (Fig. 5). They experimented with scriptwriting, character creation, and hardware placement, eventually settling on a narrated short story to give the plants a historical voice, done in both English and Dutch. It is entirely possible we start to see “talking plants” in the UU Botanical Gardens in the future!

Fig. 4: Completed Cocos Orchid prototype.

Fig. 5: Electronics design for talking plant.
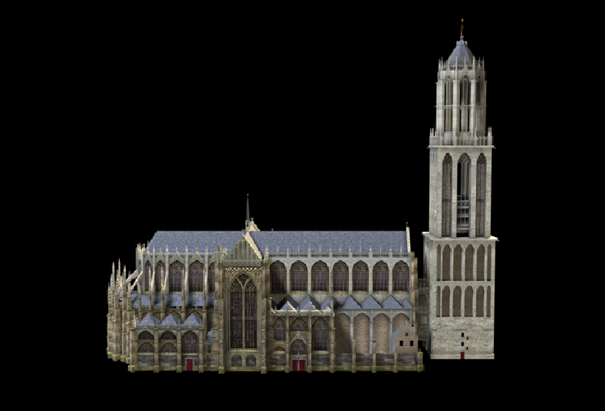
Project Utrecht: Project Utrecht grew out of the team’s desire to create a station for connecting students. Their process involved a number of quick pivots: an initial idea for a volunteering app to serve as a station between students turned into a focus on public art and projections in the spirit of the Kleur de Stad project. From there, the team developed an ambitious concept for a city-wide nighttime installation in celebration of the 2026 UU lustrum. Following engagement with the UU lustrum committee and the head of the Kleur de Stad project (for insights into technological needs and costs), they created a prototype historical projection for the Sonnenborgh Observatory complete with scripted narration and hand-drawn, stop-motion–style animations. Designed as a mechanism to bring students together (in alignment with the theme), this projection was planned as part of a series of projections throughout Utrecht that culminated in a student art competition wherein participants submit their own vision for the future of the UU’s Minnaert Building (Fig. 6). As part of their prototype, the team produced their own animated demo to illustrate what student submissions might look like.

Fig. 6: Example of art projected onto the Minnaert Building.
While financially challenging to implement, what emerged from their many pivots is a clear workable prototype that demonstrates the potential of projections as a way of making the city’s layered history visible while bringing students together. In fact, the prototype has led to the team being invited to scale-down and adapt the project to fit into the upcoming UU Lustrum in 2026!8
ELTE
Budapest Above & Below: This team aimed at creating something physical that anyone could enjoy. After their first meeting, they quickly came up with an idea of storytelling posters. With a shared interest in the history of metro stations – Budapest opened one of the first metro lines in Europe in 1896 – their idea for placing informative historical posters at public metro stations came to life. After analyzing their target audience (commuters) and confirming interest in their project, they started with historical and design research. After looking up information on the metro stops Astoria, Deák-, Kálvin- and Blaha Lujza square, they decided to create a prototype poster for Astoria, since this stop is located next to the ELTE Humanities campus (Fig. 7). The future of this project lays in extending from one to several posters with a QR-code leading to a website with an interactive map of Budapest that shares more information and locations. At its core, the project explores how the city’s identity is shaped by stories, histories and everyday experiences that unfold both on the surface and in its underground spaces.

Fig. 7: Final poster placed in the Astoria metro station.
The Mannequin’s Message: Viewing museums as “stations of knowledge”, this group centred on creating a physical media product that was multisensory, interactive, educationaland applicable for use in museums, exhibitions, and even schools. Specifically, they wanted to target youth to help them process sensitive historical events, as the group shared a common interest in the symbolic deconstruction of the Nazi regime. After talking to several experts in the museum, pedagogy and Holocaust field, the group decided to continue their project, while being extremely aware of the sensitivity of this topic. Their first idea was to present a life-size mannequin wearing a borrowed Nazi uniform, although this quickly became unfeasible. They then pivoted to a hand size doll/puppet, where the participant can remove parts of the costume (Fig. 8). Pressure sensors on a table would get activated if a piece is removed from the mannequin and placed on its spot, which would then tell the historical ideology behind it in an audio recording. The project comes with an extensive reader for adults on how Nazi uniforms are designed specifically to mediate ideological values and how they have been used as tools of ideological manipulation of the masses. Together this project invites further dialogue across generations about the symbolism of power, the history of fascist identities, and how social and cultural forces shape ideologies.

Fig. 8: Prototype of Nazi mannequin.
Silent Connections: Focused on highlighting the historical interconnectivity of Hungary and the Netherlands, this group created a fusion of a city walk and a silent disco event, accompanied by an English language audio guide. The guide focuses on voicing the invisible Dutch influence on Budapest’s 7th District from 1910 to today, and is targeted at people who are open to experience the historical connections between these cultures in an experimental way. After collecting historical and technical information by several stakeholders (local Dutch historians and an IT and sound engineer), a route with four stops was created (Fig. 9). By embedding NFC-tags at specific landmarks, the audio could be triggered automatically when a user’s device comes within the tag’s range, linking each location to a corresponding audio-file. The interface of the web design is made visible in Canva and a selection of Dutch and Hungarian music fitting the historical time period (and equal to the duration of the entire walk) was created in Spotify. In the end, an 11-minute audio guide was recorded including self-composed organ music with a choir, historical information, and self-recorded natural soundscapes such as footsteps and train station noises. This prototype represents a unique manifestation of the cross-cultural exchange made possible by the collaboration between the parallel UU and ELTE courses.

Fig 9: Example of one of the locations along the route.
Conclusion:
The Living Pasts: Exploring Futures course once again demonstrated what becomes possible when students are given room to explore, create, and connect. What began as an open-ended theme quickly grew into a variety of thoughtful, well-crafted prototypes shaped by unearthed histories, grounded in input from present-day stakeholders, and designed to elicit reflection on the future. In its essence, Living Pasts blends historical inquiry with making, and academic reflection with community relevance. It is a reminder that the past is not only something to study, but something to build with, a living resource for understanding the present and imagining more connected futures.
About the authors: The authors were all Fall 2025 course facilitators. Toine Pieters was a co-founder of the course. David Skogerboe has served as a facilitator for three years. Anouk van Wijhe was a student of the course in Fall 2023 and has since served as a facilitator in both Utrecht and Budapest. Thomas Wind has served as a facilitator for two years, and was also central to initiating the CHARM-EU collaboration.
- All images were taken by course facilitators and are used with permission ↩︎
- The Utrecht Time Machine was launched in 2021 by founders of the course, and it follows the same principles. ↩︎
- Van der Tuin I. Key texts on interdisciplinary higher education. Bristol: Bristol University Press, 2025, pp. 125-194; Krier, S. (2015-2020). UCR Art and Design Practice [Online Course Archives]. https://www.artanddesignpractice.nl/; Carvalho, L., & Yeoman, P. (2018). “Framing learning entanglement in innovative learning spaces: Connecting theory, design and practice”. British Educational Research Journal, 44(6), 1120-1137. https://doi.org/10.1002/berj.3483 ↩︎
- Zeivots, S., Hopwood, N., Wardak, D., & Cram, A. (2025). “Co-design practice in higher education: practice theory insights into collaborative curriculum development”. Higher Education Research & Development, 44(3), 769–783. https://doi.org/10.1080/07294360.2024.2410269; Martinez-Maldonado, R., Goodyear, P., Carvalho, L., Thompson, K., Hernandez-Leo, D., Dimitriadis, Y., et al. (2017). “Supporting collaborative design activity in a multi-user digital design ecology”. Comput. Human Behav. 71, 327–342. doi: 10.1016/j.chb.2017.01.055 ↩︎
- Two previous students held roles as facilitators in this iteration. Troost I , van den Bosch L. J. , Nederlof N. , Nazar S., Wijers M. , Bakker A. , Pieters T. (2024) “Student assistants as mentor-participants: a case study of distributing leadership in academic co-design education.” Frontiers in Education, 9. DOI=10.3389/feduc.2024.1389065 ↩︎
- Students in Utrecht and Budapest were put into pairs. The peers met three times digitally, where they completed three shared assignments together, focused on exploring the theme, reflecting on cultural differences, exchanging peer feedback, and creating a joint broader message to the world. The peer assignments were designed by CHARM-EU: CHARM-EU Transnational and Intercultural Learning Toolkit ↩︎
- The first shared theme was in 2024: “Beyond the Walls.” ↩︎
- This will not be the first Living Pasts prototype to get formally created. In 2021, a team created an educational escape room that was formally implemented in the Museum van Zuilen and is still in operation today. And a team in 2022 created a documentary titled “Living Memories of Lombok” that was later aired on RTV Utrecht in August 2022. ↩︎